Why a Stock Market Crash Could Be Just Around the Corner
Something is foretelling that a severe stock market crash could be just around the corner.
Therefore, investors shouldn’t get complacent. Returns from stocks could be much lower in the coming quarters, versus what they were in the past few quarters. Don’t be shocked if the stock market plummets by 20–40%.
Advertisement

There’s one economic indicator that investors need to watch closely: yield curve. This indicator essentially plots the yields on bonds of various maturities. It’s a powerful indicator of what could be ahead for the economy and stock market returns.
Often, the yield curve goes from being inverted toward being “normal.” The technical term for this is “steepening.” It happens when the yield of long-term bonds doesn’t rise as fast as the yield on short-term bonds. When this happens, we get a stock market crash.
This has happened twice since 2000.
Stock Market Crashed in 2000 & 2008
Take a look at the chart below. It plots the yield curve between early 2000 and mid-2002—at the top and the bottom of the stock market.
As the yield curve bottomed in 2000, the stock market made a definitive top. Then, as soon as the yield curve started to move higher (steepen), stockholders started selling their shares and a major stock market crash followed.
If you had held shares of an index fund that tracked the S&P 500 between the time the yield curve bottomed and the time it soared well above normal territory, you would have lost about 40% of your investment.
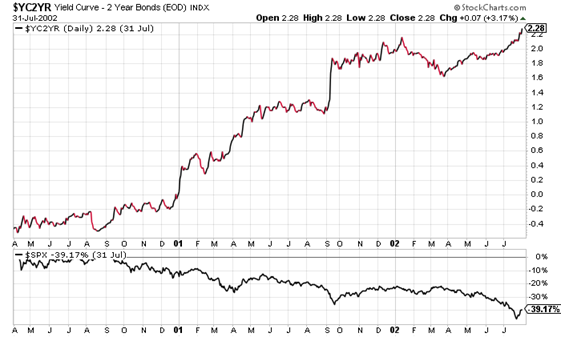
Chart courtesy of StockCharts.com
Fast-forward to late 2006: the yield curve started to bottom again. At that time, no one had really predicted what was ahead. As the yield curve started to move higher, the stock market formed definitive tops.
Eventually, stockholders again started selling their shares as the yield curve steepened further. Then, in September 2008, a rigorous stock market crash started.
If you had held shares of an index fund that tracked the S&P 500 throughout that time, you would have lost more than 30% of your investment. In the midst of the severe selling on the stock market between late September 2008 and early March 2009, your losses would have actually been much higher than 40%.
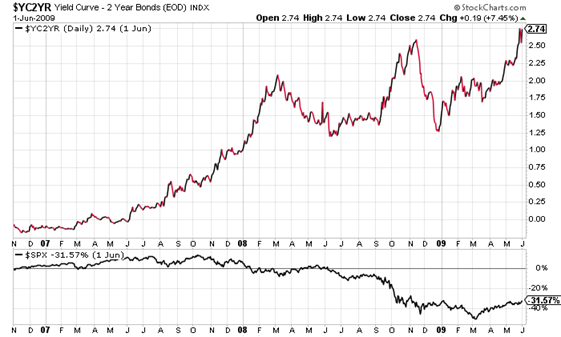
Chart courtesy of StockCharts.com
Will This Time Be Different?
What’s the yield curve telling us about the stock market now? Take a look at the below yield curve chart.
It’s—for now at least—safe to assume that the yield curve bottomed in early July of this year. What will happen to the stock market in the coming quarters?
If history repeats itself, a stock market crash is nearing. In fact, a stock market top could already be in place.
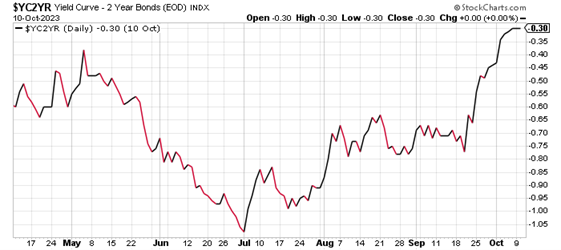
Chart courtesy of StockCharts.com
Dear reader, predicting exact tops and bottoms is impossible; you only know about them once they’re in place. However, when the stars are lining up for a stock market crash, investors shouldn’t be complacent.
I’m not saying to sell everything and stay on the sidelines; sell-offs and stock market crashes open many doors of opportunity. In the long run, investors can make more money by staying in the market than by being away from it.
However, whenever the odds of a stock market crash increase, it isn’t a bad idea to raise some cash. If the stock market does drop, those with cash on hand can scoop up great stocks at a discount.